Learn which link-in-bio metrics matter—page views, per-link clicks, devices, and referrers—and how LinkTree analytics helps you optimize your page.
Quick answer: The most useful link-in-bio analytics are page views, clicks per link, click-through rate (CTR), device type, and referrer source. LinkTree includes these in a 30-day dashboard so you can reorder links and double down on what works.
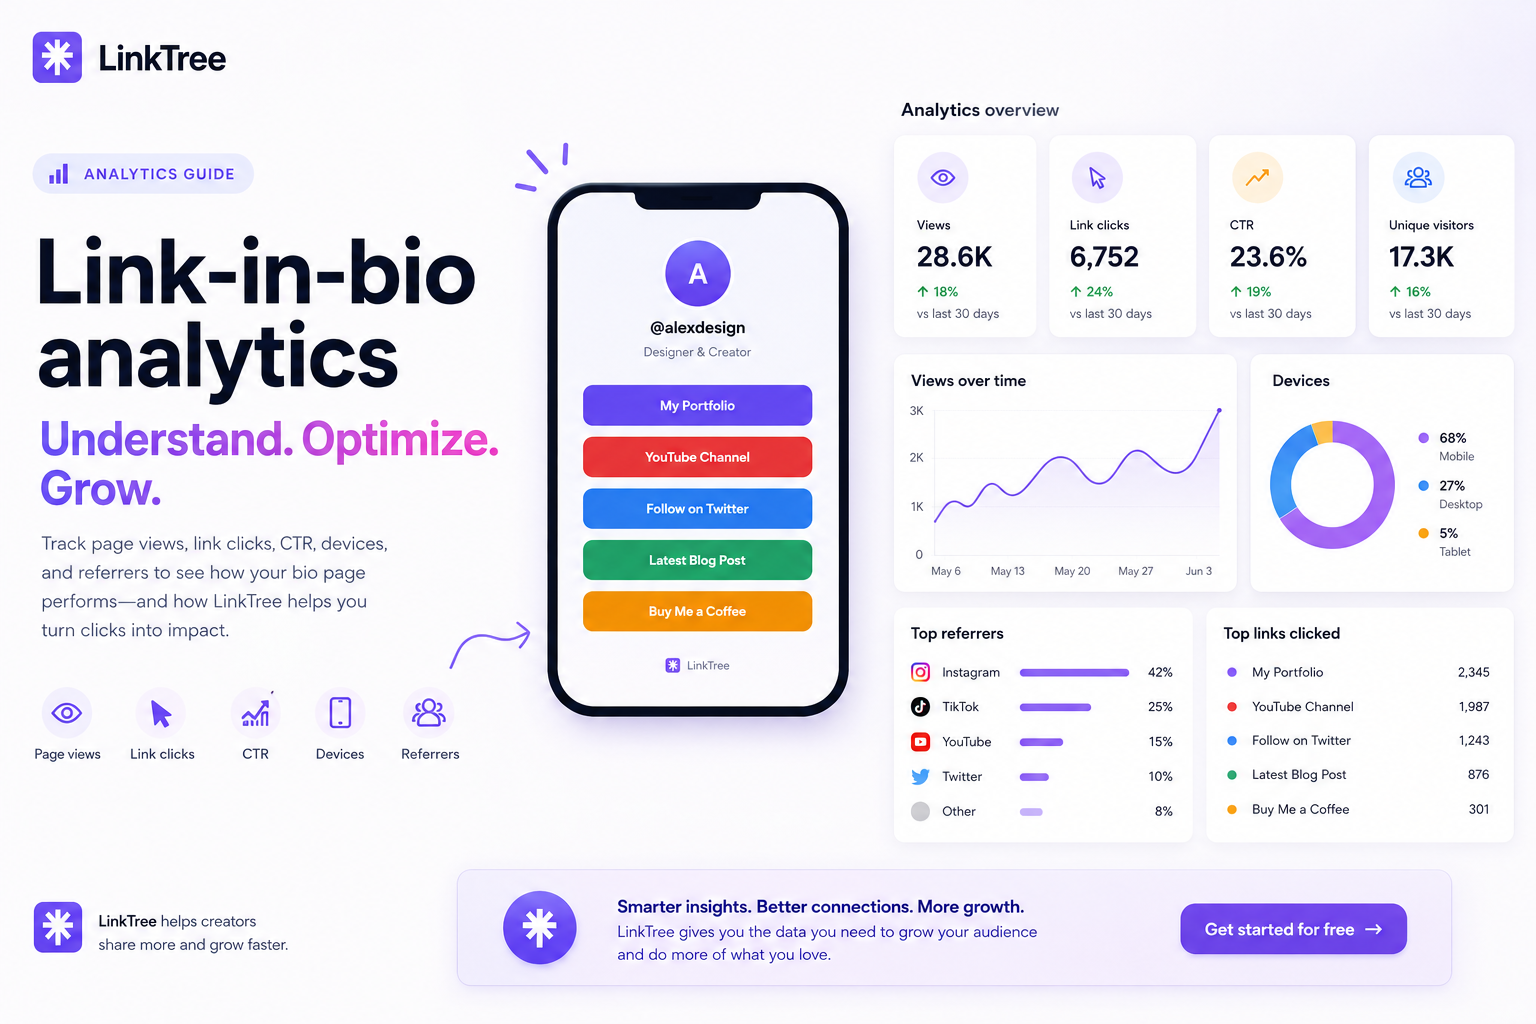
Metrics that actually change your strategy
1. Page views
Shows how many people opened your bio URL. Spikes usually follow a viral post or a story swipe-up—use them to time new offers.
2. Clicks per link
Each button has its own count. If your shop link gets 10× more clicks than your podcast, put the shop higher or rewrite the podcast label.
3. Click-through rate (CTR)
CTR = clicks ÷ views. Low CTR with high views means your layout or labels need work—not that your audience is uninterested.
4. Device breakdown
Most bio traffic is mobile. If tablet/desktop share grows, you might be driving email or web traffic—optimize preview text accordingly.
5. Referrers
See whether Instagram, TikTok, or direct traffic sends visitors. Align content on the platform that actually drives clicks.
How to improve results with LinkTree
- Reorder links — drag highest-intent offers to the top
- A/B test button titles — “Free sample” vs “Shop now” changes CTR
- Schedule links — swap hero offers during launches
- Use themes — contrast helps buttons stand out on small screens
Open features to see analytics alongside themes and scheduling.
Frequently asked questions
Does LinkTree track individual link performance?
Yes. Each link records clicks plus referrer data where available.
How long is history stored?
Charts focus on the last 30 days—ideal for weekly optimization habits.
Do I need a separate analytics tool?
Many creators only need bio analytics plus their shop or email platform stats. Start with LinkTree, then add Google Analytics on your main site if you have one.